|
| | PC1_pre |
| | (1) | (2) | (3) | (4) | (5) | (6) | (7) | (8) | (9) | (10) | (11) | (12) | (13) | (14) | (15) | (16) | (17) |
|
|
| (Intercept) | 0.483*** (0.000) | -0.795*** (0.000) | 0.435 (0.248) | -0.173 (0.634) | 0.164 (0.656) | -0.207 (0.598) | -0.056 (0.885) | 0.253 (0.499) | 0.539 (0.165) | 0.516 (0.176) | 0.130 (0.723) | 0.891* (0.031) | 0.632 (0.108) | 0.581 (0.139) | 1.251** (0.002) | 0.543 (0.160) | 0.466 (0.211) |
| At_Risk_of_Destitution | -0.018*** (0.000) | | | | | | | | | | | | | | -0.014*** (0.000) | | |
| Satisfied_With_Income: 2. Mostly dissatisfied | | 0.260 (0.278) | | | | | 0.078 (0.729) | | | | | | | | | | |
| Satisfied_With_Income: 3. Somewhat dissatisfied | | 0.731*** (0.001) | | | | | 0.484* (0.020) | | | | | | | | | | |
| Satisfied_With_Income: 4. Neither satisfied nor dissatisfied | | 0.965*** (0.000) | | | | | 0.637** (0.004) | | | | | | | | | | |
| Satisfied_With_Income: 5. Somewhat satisfied | | 0.891*** (0.000) | | | | | 0.553** (0.010) | | | | | | | | | | |
| Satisfied_With_Income: 6. Mostly satisfied | | 1.262*** (0.000) | | | | | 0.760*** (0.001) | | | | | | | | | | |
| Satisfied_With_Income: 7. Completely satisfied | | 0.890** (0.007) | | | | | 0.314 (0.325) | | | | | | | | | | |
| Age | | | 0.015*** (0.000) | 0.012*** (0.000) | 0.013*** (0.001) | 0.016*** (0.000) | 0.014*** (0.000) | 0.015*** (0.000) | 0.013*** (0.000) | 0.013*** (0.000) | 0.016*** (0.000) | 0.014*** (0.000) | 0.013*** (0.000) | 0.014*** (0.000) | 0.009** (0.006) | 0.013*** (0.000) | 0.014*** (0.000) |
| next_election: Labour | | | -2.270*** (0.000) | -2.214*** (0.000) | -2.277*** (0.000) | -2.286*** (0.000) | -2.256*** (0.000) | -2.288*** (0.000) | -2.257*** (0.000) | -2.261*** (0.000) | -2.293*** (0.000) | -2.217*** (0.000) | -2.253*** (0.000) | -2.265*** (0.000) | -2.251*** (0.000) | -2.264*** (0.000) | -2.284*** (0.000) |
| next_election: LibDem | | | -2.265*** (0.000) | -2.247*** (0.000) | -2.281*** (0.000) | -2.281*** (0.000) | -2.207*** (0.000) | -2.292*** (0.000) | -2.259*** (0.000) | -2.263*** (0.000) | -2.281*** (0.000) | -2.253*** (0.000) | -2.263*** (0.000) | -2.235*** (0.000) | -2.274*** (0.000) | -2.263*** (0.000) | -2.315*** (0.000) |
| next_election: Nat/Green | | | -2.605*** (0.000) | -2.554*** (0.000) | -2.640*** (0.000) | -2.649*** (0.000) | -2.583*** (0.000) | -2.638*** (0.000) | -2.572*** (0.000) | -2.566*** (0.000) | -2.653*** (0.000) | -2.573*** (0.000) | -2.575*** (0.000) | -2.608*** (0.000) | -2.600*** (0.000) | -2.582*** (0.000) | -2.650*** (0.000) |
| next_election: No Vote/DK/Refused | | | -1.010*** (0.000) | -0.977*** (0.000) | -1.033*** (0.000) | -1.034*** (0.000) | -0.994*** (0.000) | -1.034*** (0.000) | -1.005*** (0.000) | -1.008*** (0.000) | -1.041*** (0.000) | -0.983*** (0.000) | -0.997*** (0.000) | -1.019*** (0.000) | -0.988*** (0.000) | -1.006*** (0.000) | -1.034*** (0.000) |
| next_election: Other/Brexit | | | -1.917*** (0.000) | -1.900*** (0.000) | -1.960*** (0.000) | -1.968*** (0.000) | -1.936*** (0.000) | -1.968*** (0.000) | -1.903*** (0.000) | -1.893*** (0.000) | -1.973*** (0.000) | -1.903*** (0.000) | -1.901*** (0.000) | -1.927*** (0.000) | -1.905*** (0.000) | -1.912*** (0.000) | -1.975*** (0.000) |
| ethnic_2: Other Ethnic | | | -0.160 (0.200) | -0.190 (0.129) | -0.113 (0.370) | -0.151 (0.231) | -0.163 (0.194) | -0.160 (0.203) | -0.176 (0.161) | -0.181 (0.149) | -0.157 (0.210) | -0.152 (0.225) | -0.175 (0.164) | -0.180 (0.152) | -0.139 (0.264) | -0.174 (0.164) | -0.164 (0.189) |
| employment_2: Working/SE Inc. Part-Time | | | 0.240* (0.030) | 0.179 (0.105) | 0.200 (0.072) | 0.172 (0.127) | 0.245* (0.027) | 0.224* (0.043) | 0.217* (0.050) | 0.196 (0.077) | 0.183 (0.104) | 0.234* (0.034) | 0.206 (0.063) | 0.195 (0.080) | 0.209 (0.057) | 0.183 (0.100) | 0.222* (0.044) |
| log(HH_Net_Income_PA) | | | 0.100 (0.153) | 0.012 (0.870) | 0.137* (0.049) | 0.165* (0.016) | 0.076 (0.302) | 0.142* (0.041) | 0.151* (0.027) | 0.149* (0.028) | 0.171* (0.012) | 0.052 (0.471) | 0.144* (0.035) | 0.090 (0.211) | 0.030 (0.665) | 0.145* (0.034) | 0.110 (0.109) |
| is_redwall | | | -0.119 (0.221) | -0.108 (0.263) | -0.149 (0.127) | -0.109 (0.262) | -0.120 (0.218) | -0.127 (0.191) | -0.138 (0.156) | -0.134 (0.166) | -0.119 (0.220) | -0.130 (0.179) | -0.127 (0.189) | -0.120 (0.216) | -0.148 (0.124) | -0.127 (0.192) | -0.145 (0.133) |
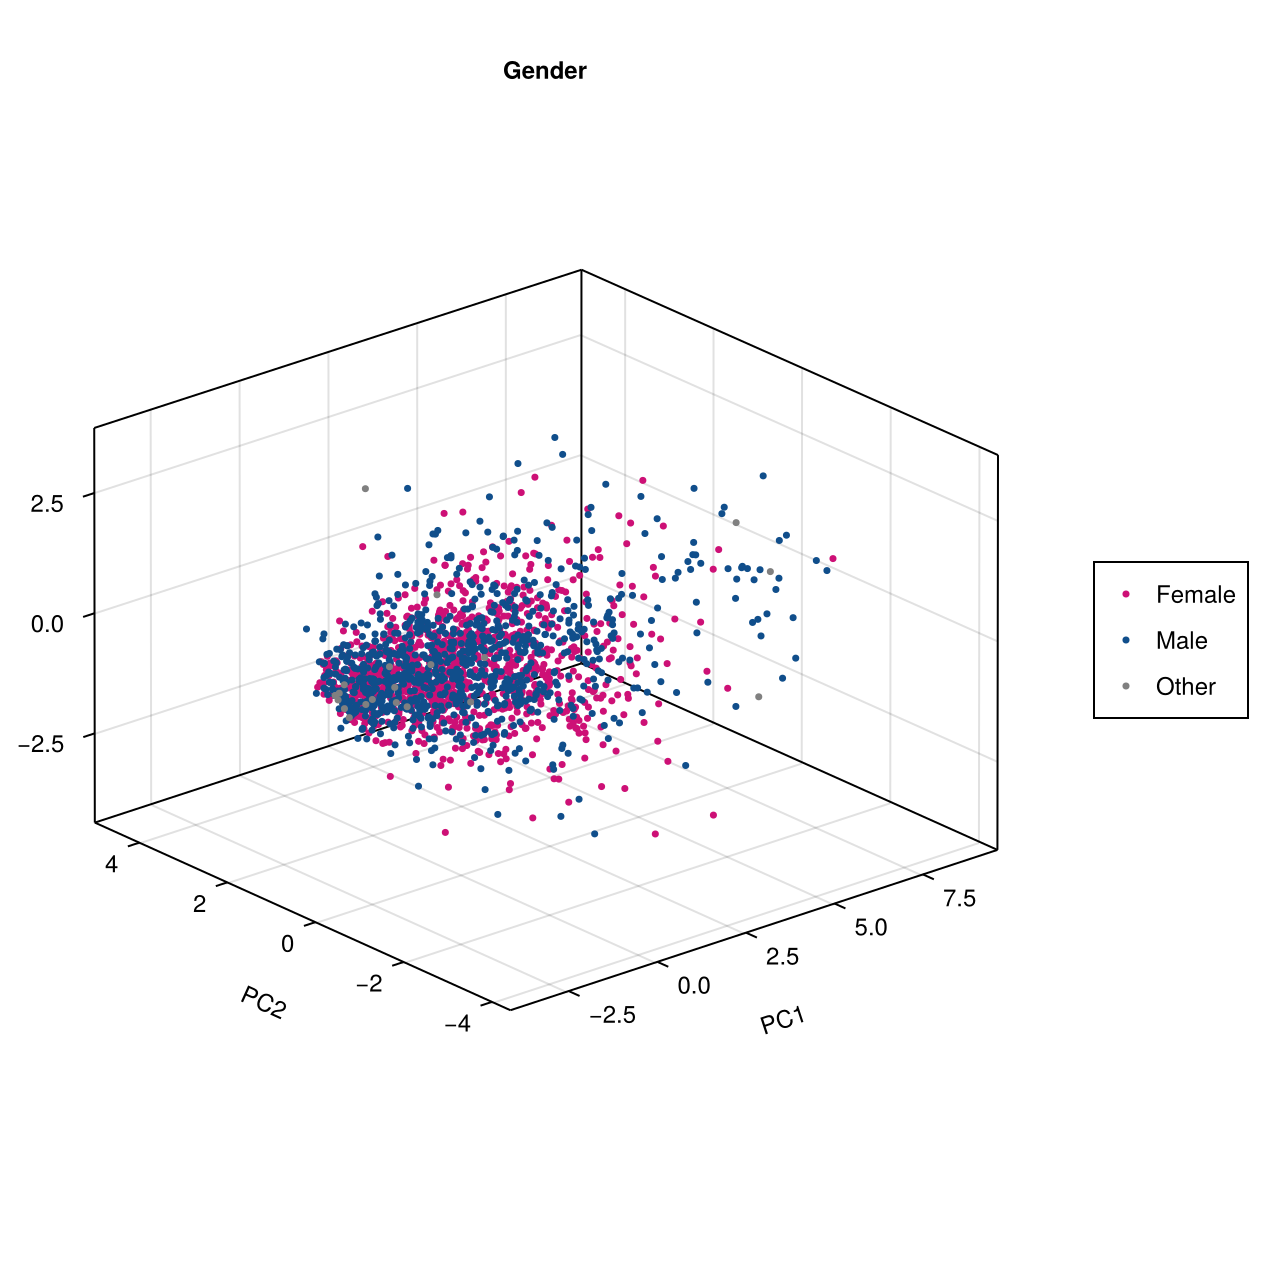
| Gender: Male | | | 0.298** (0.001) | 0.290** (0.002) | 0.297** (0.002) | 0.280** (0.003) | 0.292** (0.002) | 0.289** (0.002) | 0.241* (0.011) | 0.239* (0.011) | 0.279** (0.003) | 0.267** (0.004) | 0.251** (0.008) | 0.300** (0.001) | 0.245** (0.008) | 0.253** (0.007) | 0.276** (0.003) |
| Gender: Other | | | 0.415 (0.364) | 0.419 (0.358) | 0.372 (0.417) | 0.405 (0.378) | 0.414 (0.365) | 0.392 (0.393) | 0.415 (0.365) | 0.410 (0.370) | 0.433 (0.346) | 0.451 (0.324) | 0.417 (0.363) | 0.442 (0.335) | 0.278 (0.539) | 0.412 (0.367) | 0.334 (0.465) |
| unsatisfied_with_income | | | -0.518*** (0.000) | | | | | | | | | | | | | | |
| Ladder | | | | 0.181*** (0.000) | | | | | | | | | | | | | |
| Owner_Occupier: Yes | | | | | 0.296** (0.008) | | | | | | | | | | | | |
| General_Health: Fair | | | | | | 0.262 (0.182) | | | | | | | | | | | |
| General_Health: Good | | | | | | 0.394* (0.037) | | | | | | | | | | | |
| General_Health: Very bad | | | | | | -0.745 (0.115) | | | | | | | | | | | |
| General_Health: Very good | | | | | | 0.360 (0.084) | | | | | | | | | | | |
| not_managing_financially | | | | | | | | -0.340* (0.011) | | | | | | | | | |
| sqrt_phq_8 | | | | | | | | | -0.145*** (0.000) | | | | | | | | |
| phq_8 | | | | | | | | | | -0.041*** (0.000) | | | | | | | |
| poorhealth | | | | | | | | | | | -0.443** (0.010) | | | | | | |
| Managing_Financially: 2. Doing alright | | | | | | | | | | | | -0.163 (0.277) | | | | | |
| Managing_Financially: 3. Just about getting by | | | | | | | | | | | | -0.571*** (0.000) | | | | | |
| Managing_Financially: 4. Finding it quite difficult | | | | | | | | | | | | -0.591** (0.003) | | | | | |
| Managing_Financially: 5. Finding it very difficult | | | | | | | | | | | | -0.916*** (0.001) | | | | | |
| sqrt_gad_7 | | | | | | | | | | | | | -0.160*** (0.000) | | | | |
| down_the_ladder | | | | | | | | | | | | | | -0.403*** (0.000) | | | |
| gad_7 | | | | | | | | | | | | | | | | -0.038*** (0.000) | |
| destitute | | | | | | | | | | | | | | | | | -0.736*** (0.000) |
|
|
| N | 1,988 | 1,988 | 1,988 | 1,988 | 1,988 | 1,988 | 1,988 | 1,988 | 1,988 | 1,988 | 1,988 | 1,988 | 1,988 | 1,988 | 1,988 | 1,988 | 1,988 |
| R2 | 0.045 | 0.024 | 0.165 | 0.171 | 0.161 | 0.162 | 0.167 | 0.161 | 0.164 | 0.165 | 0.161 | 0.169 | 0.165 | 0.164 | 0.181 | 0.164 | 0.168 |
|